
Turning Waste into Opportunity: Mapping Ontario's Organic Resources
An article by Ushnik Mukherjee
Department of Civil and Environmental Engineering, University of Waterloo, ON, Canada
A new open dataset published in Scientific Data maps livestock manure and food waste generation, along with their nitrogen and phosphorus content, across Ontario at a 30 m × 30 m resolution for 2021. It is the first province-wide gridded dataset of its kind. The work was led by Ushnik Mukherjee and Nandita Basu (University of Waterloo), with Jake DeBruyn of the Ontario Ministry of Agriculture, Food and Agribusiness (OMAFA), Juliane Mai, and Rebecca Saari. The project built on a barn inventory that DeBruyn and colleagues began years earlier through the Agricultural Renewable Natural Gas Resource Clustering Study with the Canadian Biogas Association. The University of Waterloo team completed and extended that inventory by identifying and classifying barns across the province from aerial imagery. Kirsten Hoekstra, Bibiana Egbunike, and Finan Turnage-Barney also contributed. The research was funded through SOLUTIONSCAPES by Environment and Climate Change Canada.
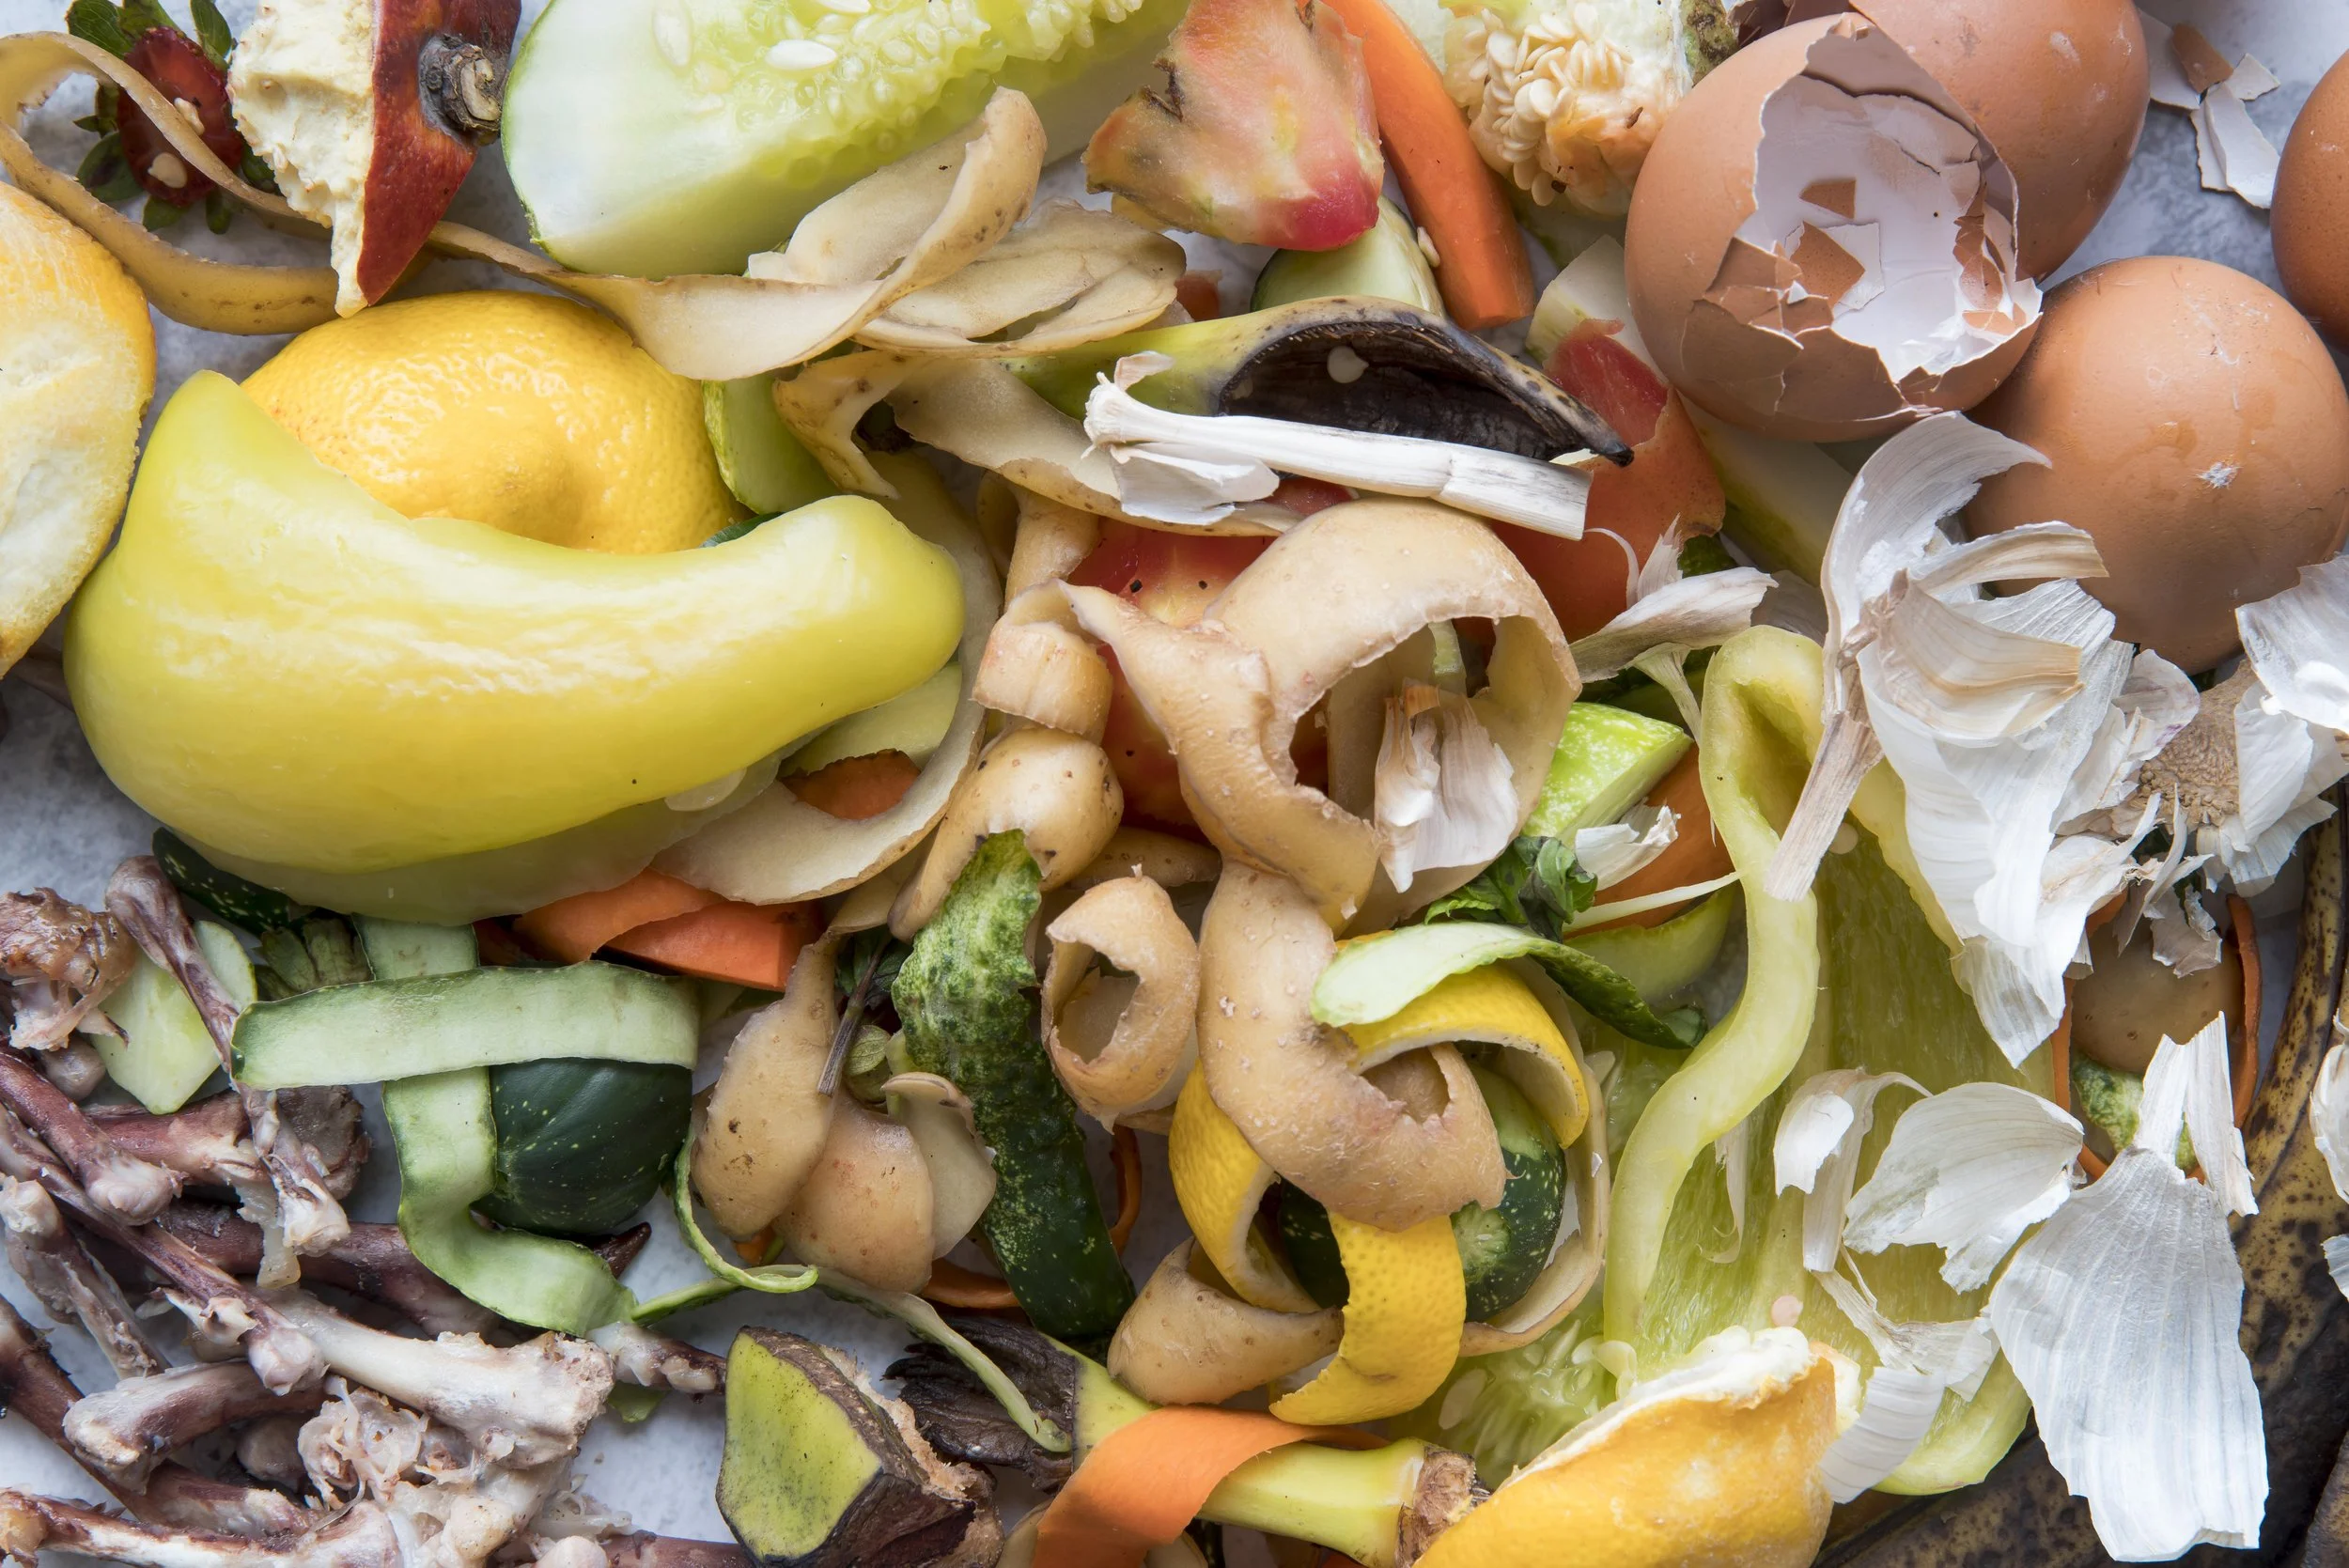
The dataset shows that Ontario generates about 31.6 million tonnes of manure and 4.83 million tonnes of food waste each year, with much of this material concentrated in a relatively small share of the landscape. About 71% of manure comes from just 25% of the manure-producing area, and nearly 60% of food waste comes from only 5.8% of the food-waste-producing area. These hotspots are hidden in coarser county- and census-level statistics. Knowing exactly where the hotspots are, helps planners find good locations for anaerobic digesters and other waste-to-resource facilities. The dataset also highlights opportunities to recycle nutrients back to cropland, while identifying areas where nutrient accumulation may pose risk to water quality. The data are freely available on figshare for researchers, planners, and policymakers.
The accompanying infographic, designed by Rachel Enright, summarizes the study at a glance. It shows the provincial totals and maps of manure and associated nutrients distributions across southern Ontario. It also walks through the two methods of the study: 1) estimating manure from barns identified in aerial imagery, and 2) estimating food waste from population and employment data in each municipality. Finally, it highlights the hotspot findings and the main applications of the data, including siting biogas digesters, planning nutrient reuse strategies, and identifying opportunities to combine manure and food waste streams.
Read the full article: Mukherjee, U., DeBruyn, J., Mai, J., Saari, R. & Basu, N. B. (2026). A high-resolution (30-m by 30-m) gridded dataset of livestock manure and food waste generation in Ontario, Canada (2021). Scientific Data. https://doi.org/10.1038/s41597-026-07282-4
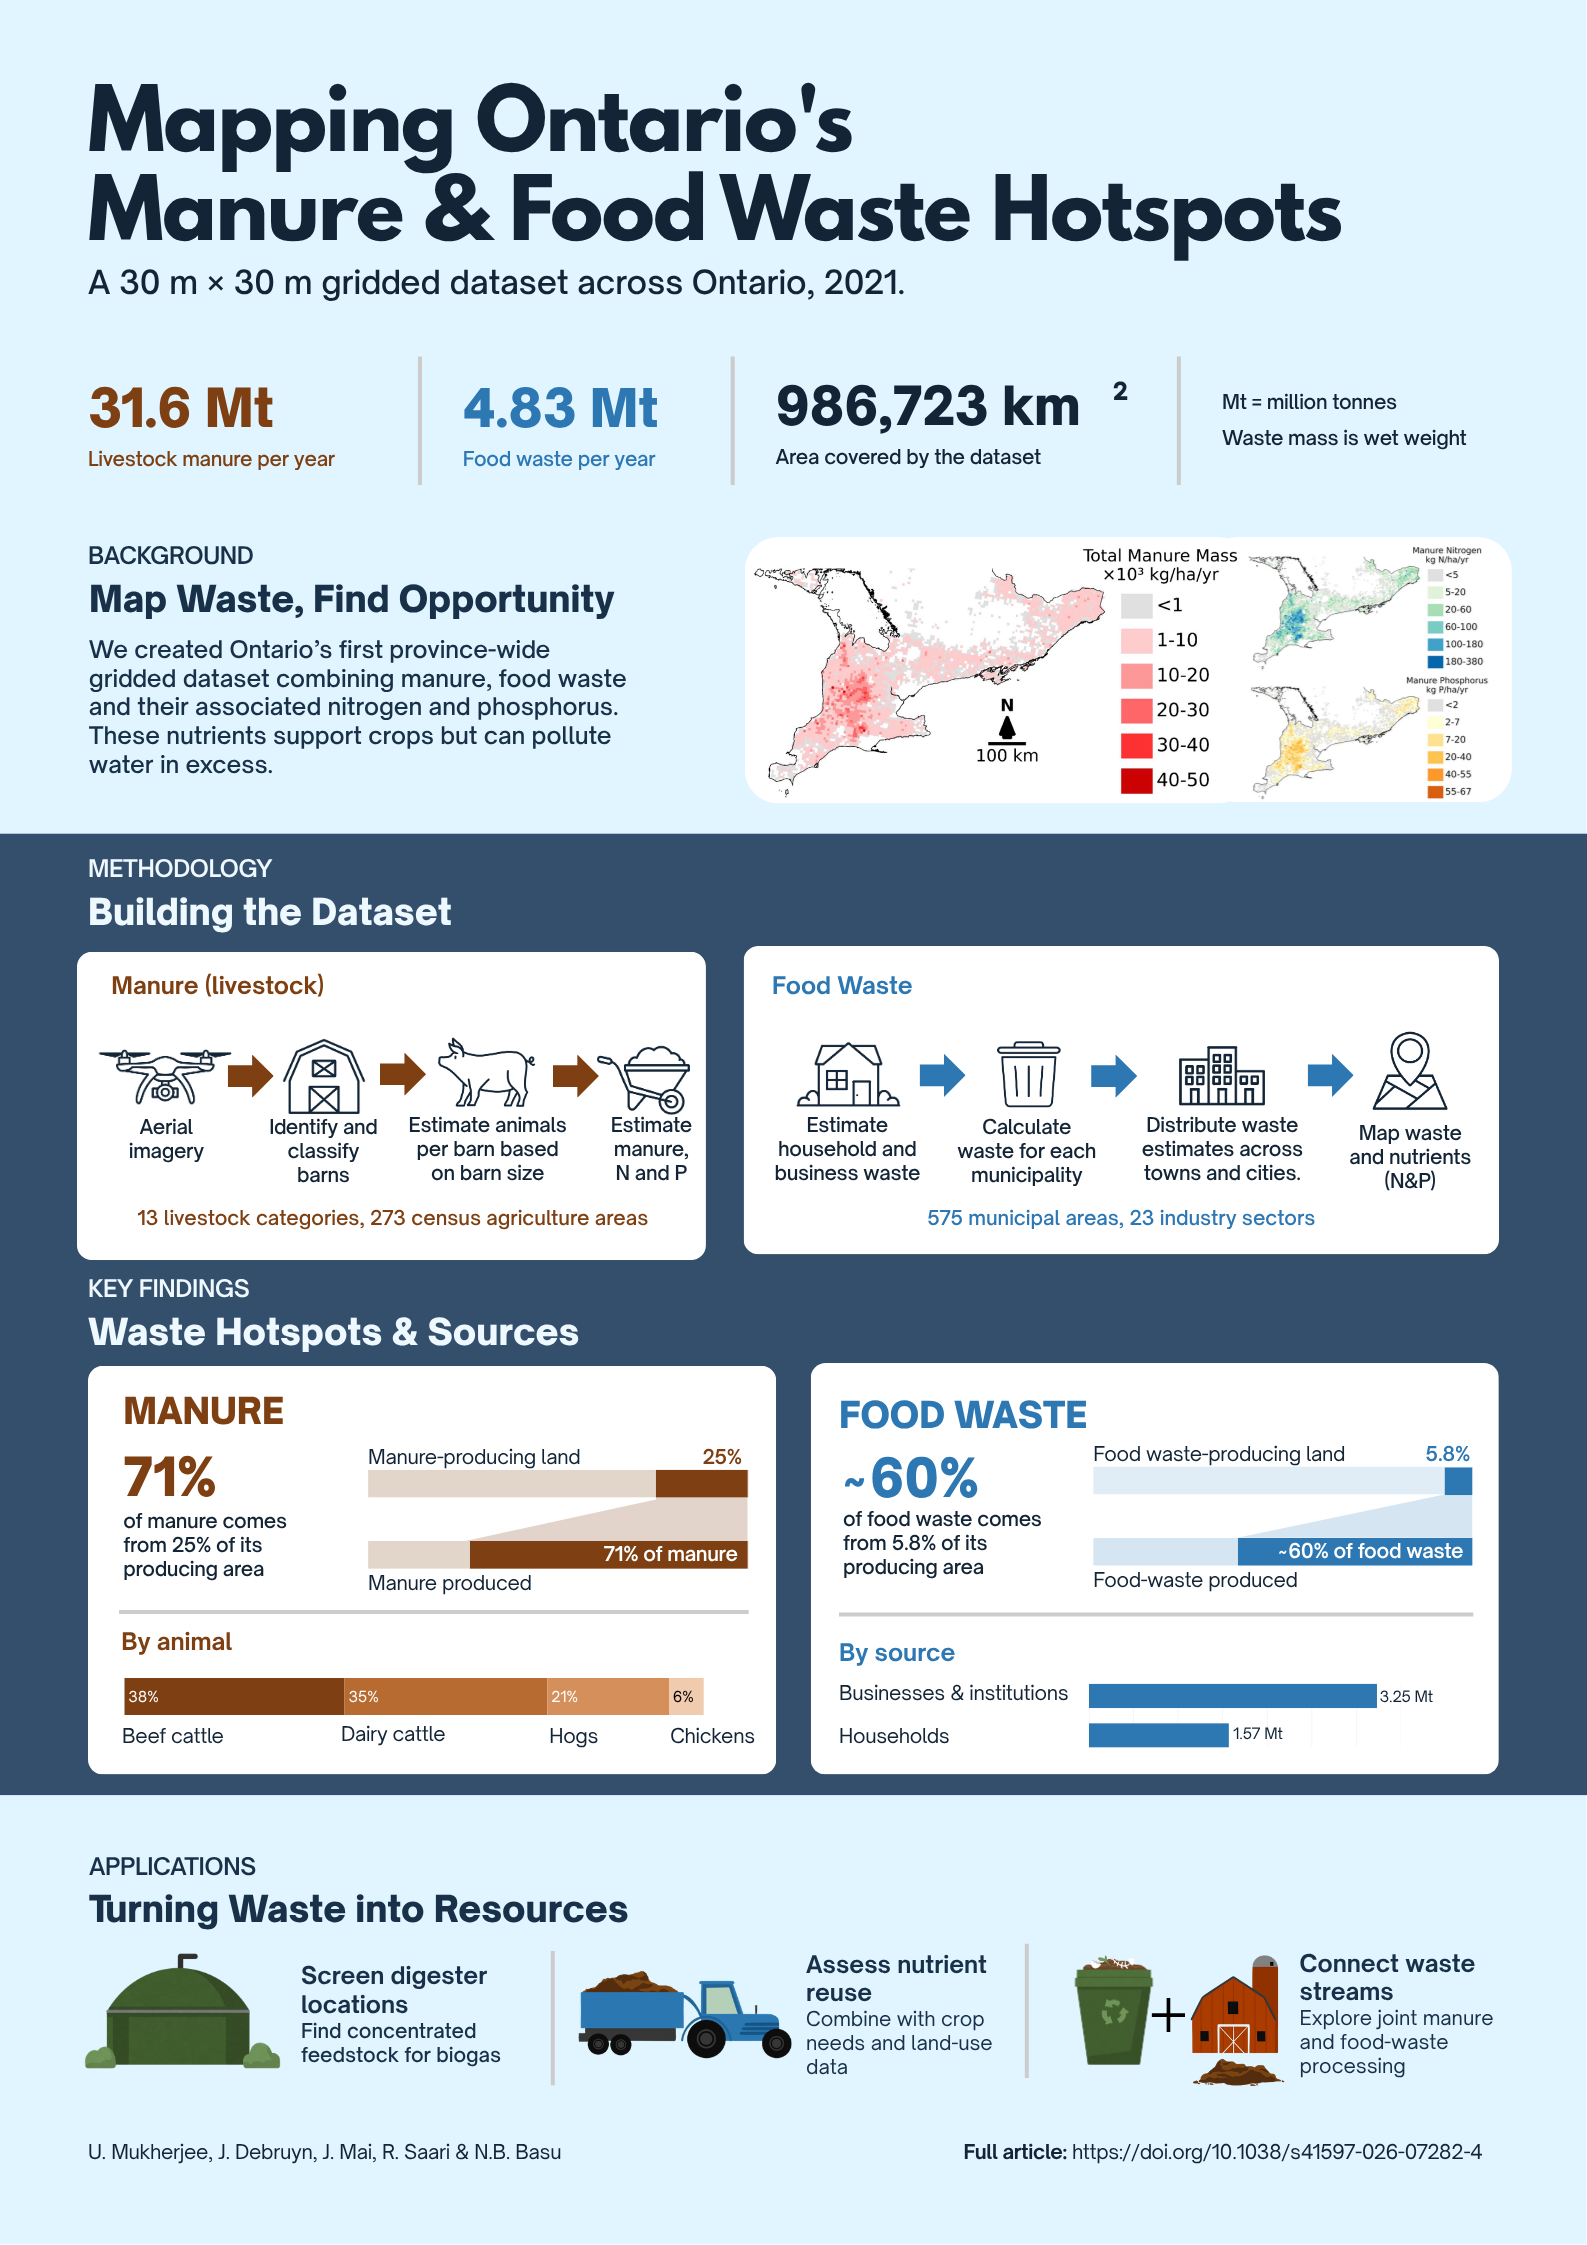
Mapping Ontario’s Manure and Food Waste Hotspots Infographic

Personal note
Ushnik Mukherjee is a Research Associate in the Department of Civil and Environmental Engineering at the University of Waterloo, working with Professor Nandita Basu's research group.
His work integrates spatial data, optimization, and systems analysis to inform the design of bioenergy and nutrient-recovery infrastructure, supporting evidence-based decision-making at the intersection of food, energy, and water resources.